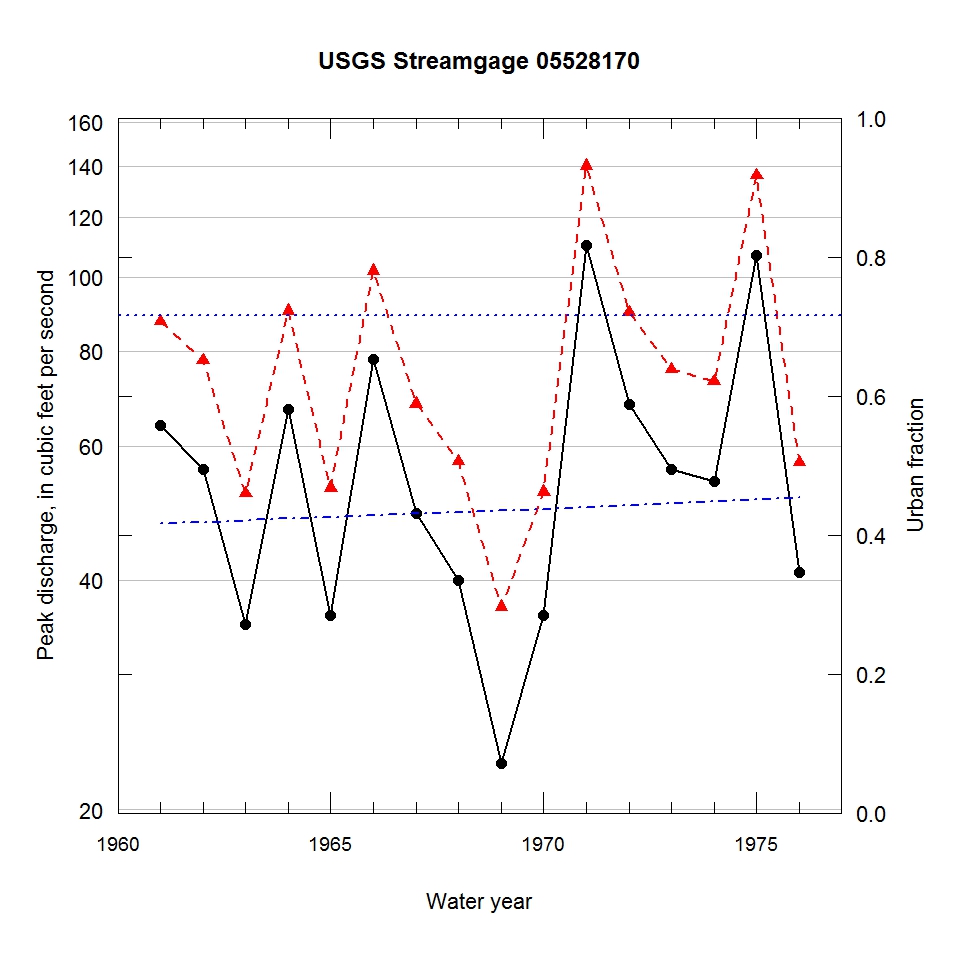
Observed and urbanization-adjusted annual maximum peak discharge and associated urban fraction and precipitation values at USGS streamgage:
05528170 DIAMOND LAKE DRAIN AT MUNDELEIN, IL


| Water year | Segment | Discharge code | Cumulative reservoir storage (acre-feet) | Urban fraction | Precipitation (inches) | Observed peak discharge (ft3/s) | Adjusted peak discharge (ft3/s) | Exceedance probability |
| 1961 | 1 | -- | 0 | 0.416 | 1.213 | 64 | 88 | 0.353 |
| 1962 | 1 | -- | 0 | 0.419 | 0.261 | 56 | 78 | 0.463 |
| 1963 | 1 | -- | 0 | 0.421 | 1.257 | 35 | 52 | 0.788 |
| 1964 | 1 | -- | 0 | 0.423 | 0.685 | 67 | 90 | 0.322 |
| 1965 | 1 | -- | 0 | 0.426 | 0.565 | 36 | 53 | 0.777 |
| 1966 | 1 | -- | 0 | 0.428 | 1.162 | 78 | 102 | 0.218 |
| 1967 | 1 | -- | 0 | 0.430 | 0.922 | 49 | 68 | 0.583 |
| 1968 | 1 | -- | 0 | 0.433 | 1.246 | 40 | 57 | 0.726 |
| 1969 | 1 | -- | 0 | 0.435 | 1.340 | 23 | 37 | 0.930 |
| 1970 | 1 | -- | 0 | 0.437 | 1.509 | 36 | 52 | 0.785 |
| 1971 | 1 | -- | 0 | 0.440 | 0.415 | 110 | 140 | 0.077 |
| 1972 | 1 | -- | 0 | 0.443 | 1.197 | 68 | 90 | 0.326 |
| 1973 | 1 | -- | 0 | 0.446 | 1.434 | 56 | 76 | 0.488 |
| 1974 | 1 | -- | 0 | 0.449 | 1.112 | 54 | 73 | 0.520 |
| 1975 | 1 | -- | 0 | 0.452 | 0.819 | 107 | 136 | 0.088 |
| 1976 | 1 | -- | 0 | 0.455 | 1.255 | 41 | 57 | 0.728 |

